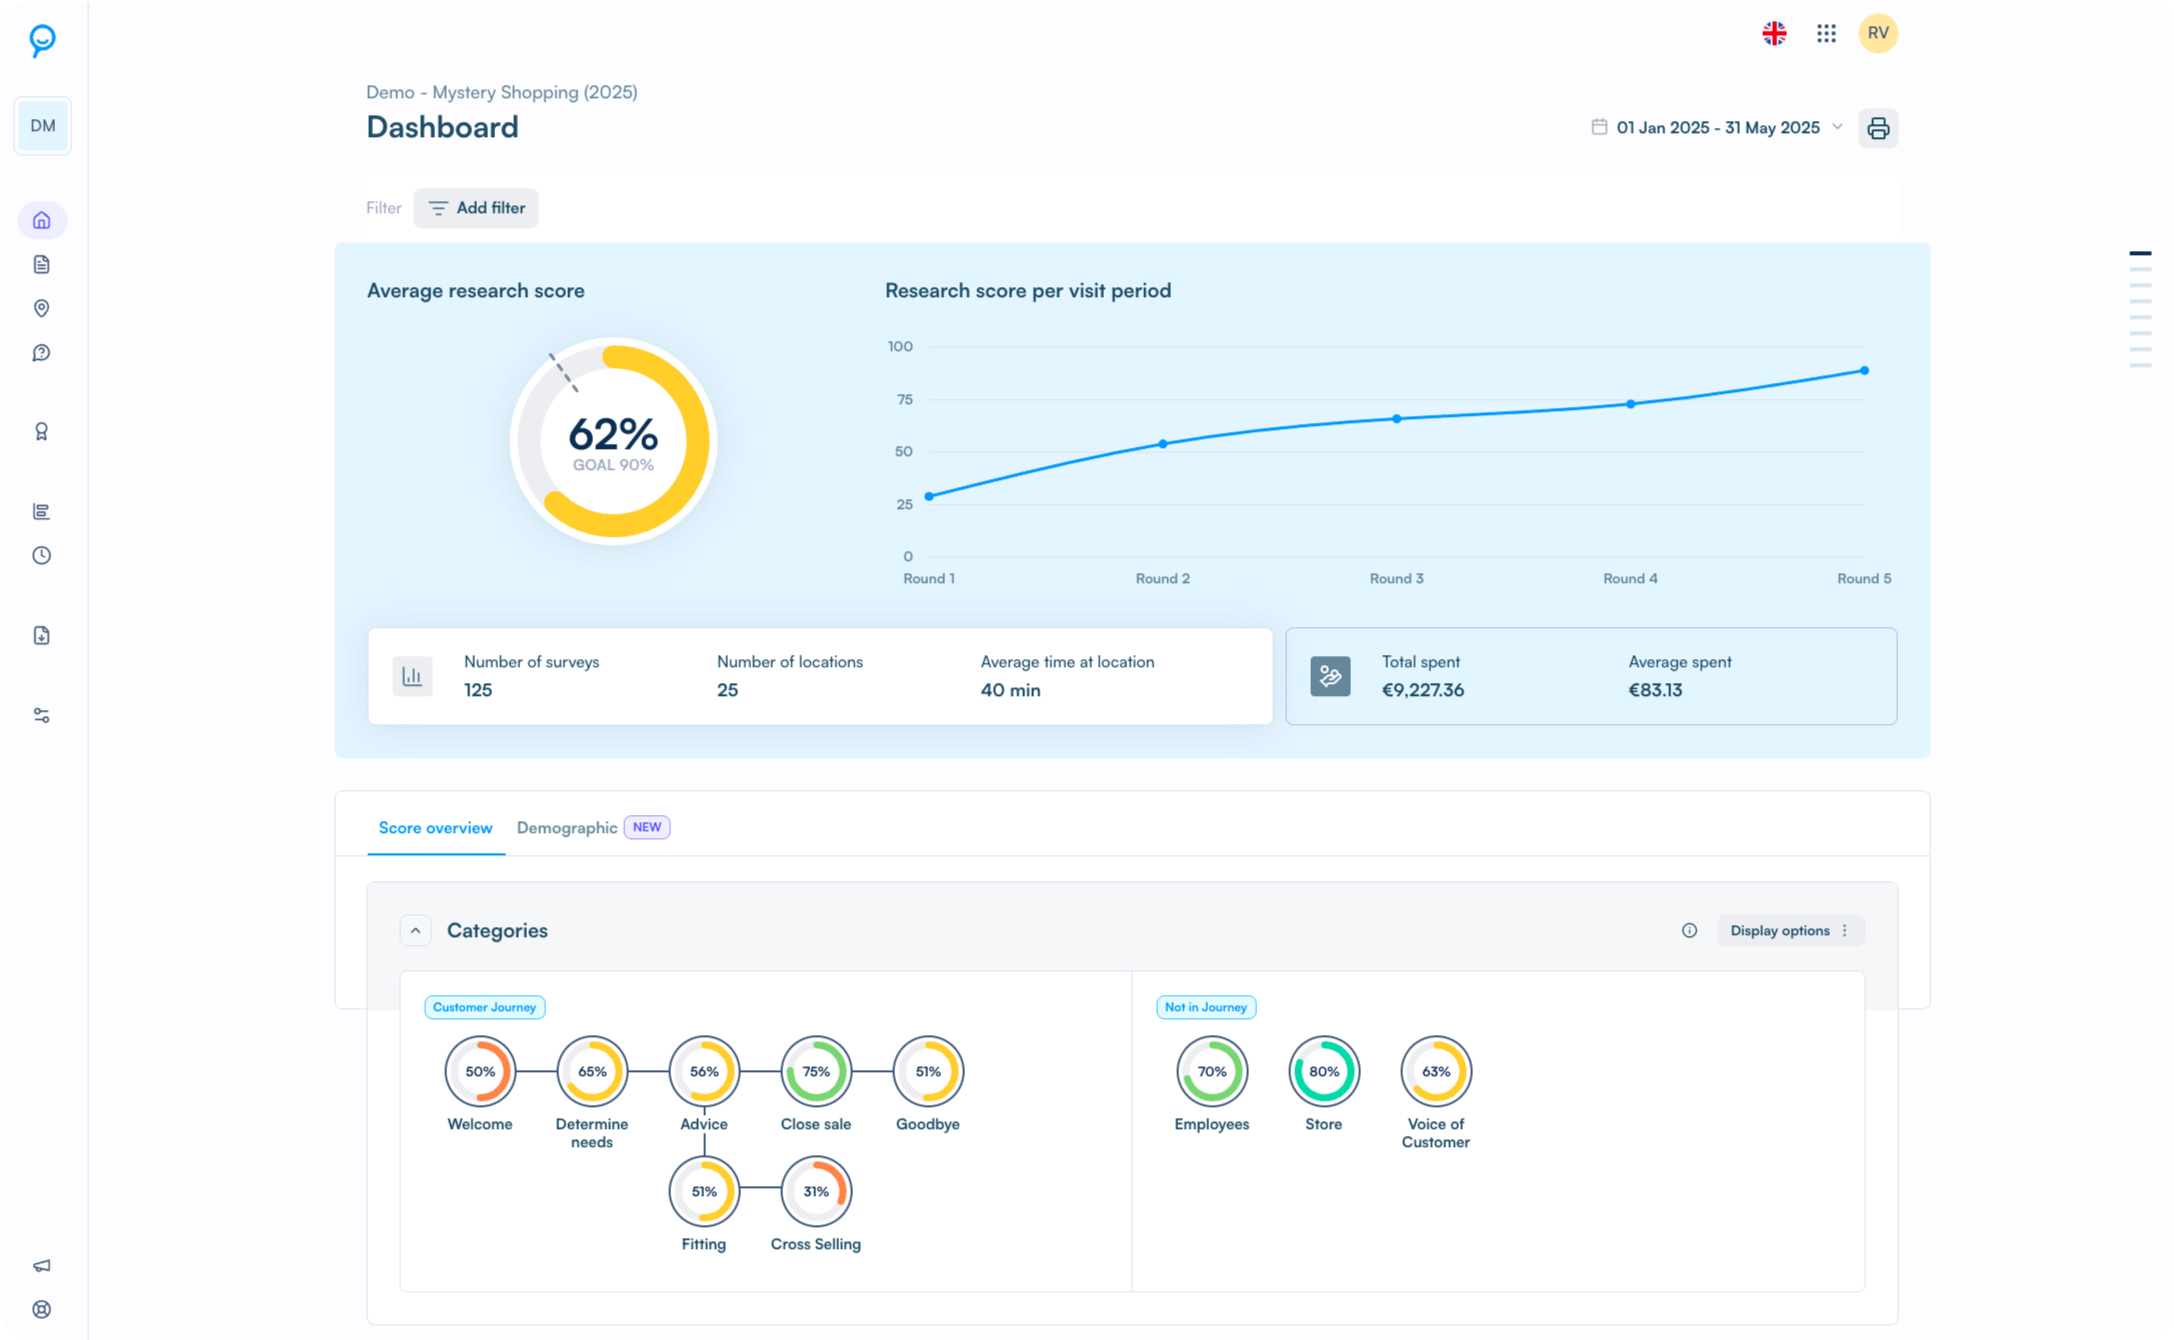
The Secret View dashboard
From feedback to action,
in one dashboard

Real-time insights at every level • Fully customizable to your organization • 100% developed in-house

Results within 24 hours

Real-time insight on every level

Fully customizable to your org

100% built in-house
Smart segmentation
Compare performance the way your business is structured
Whether you manage locations by region, district manager, franchise group or store format, the Secret View dashboard helps you identify where performance differs and where support is needed.
Regions
Compare performance across different areas
District managers
See immediately which teams excel or need adjustment

Store types
Discover trends by format or concept
And more...
Add locations to as many segments as you want
Full AI integration
AI integration for even better insights into customer experience
Quality control, summaries, and improvement recommendations: AI helps you analyze and improve faster and smarter.

AI Quality Control
Reviewing surveys
While the survey is filled in, 200+ AI-driven checks assess answers for quality, consistency and reliability, giving shoppers feedback on the spot.
- ✓
Results ready right after the visit
- ✓
Higher reliability of feedback
- ✓
Consistency across answers
AI Summaries
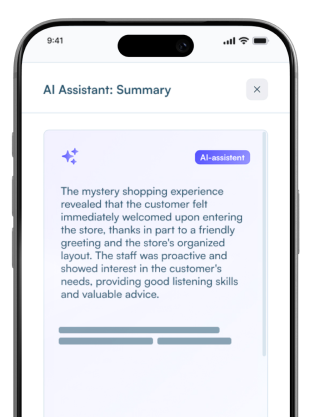
Summarizing surveys
No time to read a full survey? The AI analyses every submitted report and writes a clear summary so you can scan the essentials in seconds.
- ✓
Instant view of the key points
- ✓
Less time spent analysing
- ✓
Surfaces trends and patterns
AI Insights
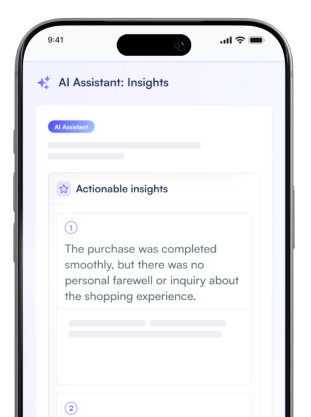
Key insights and strengths
Specific improvement advice based on your results. Not only what went wrong, but the concrete next steps, prioritised by impact.
- ✓
Strengths and best practices
- ✓
Concrete actions to improve
- ✓
Prioritised by impact
The Secret View dashboard
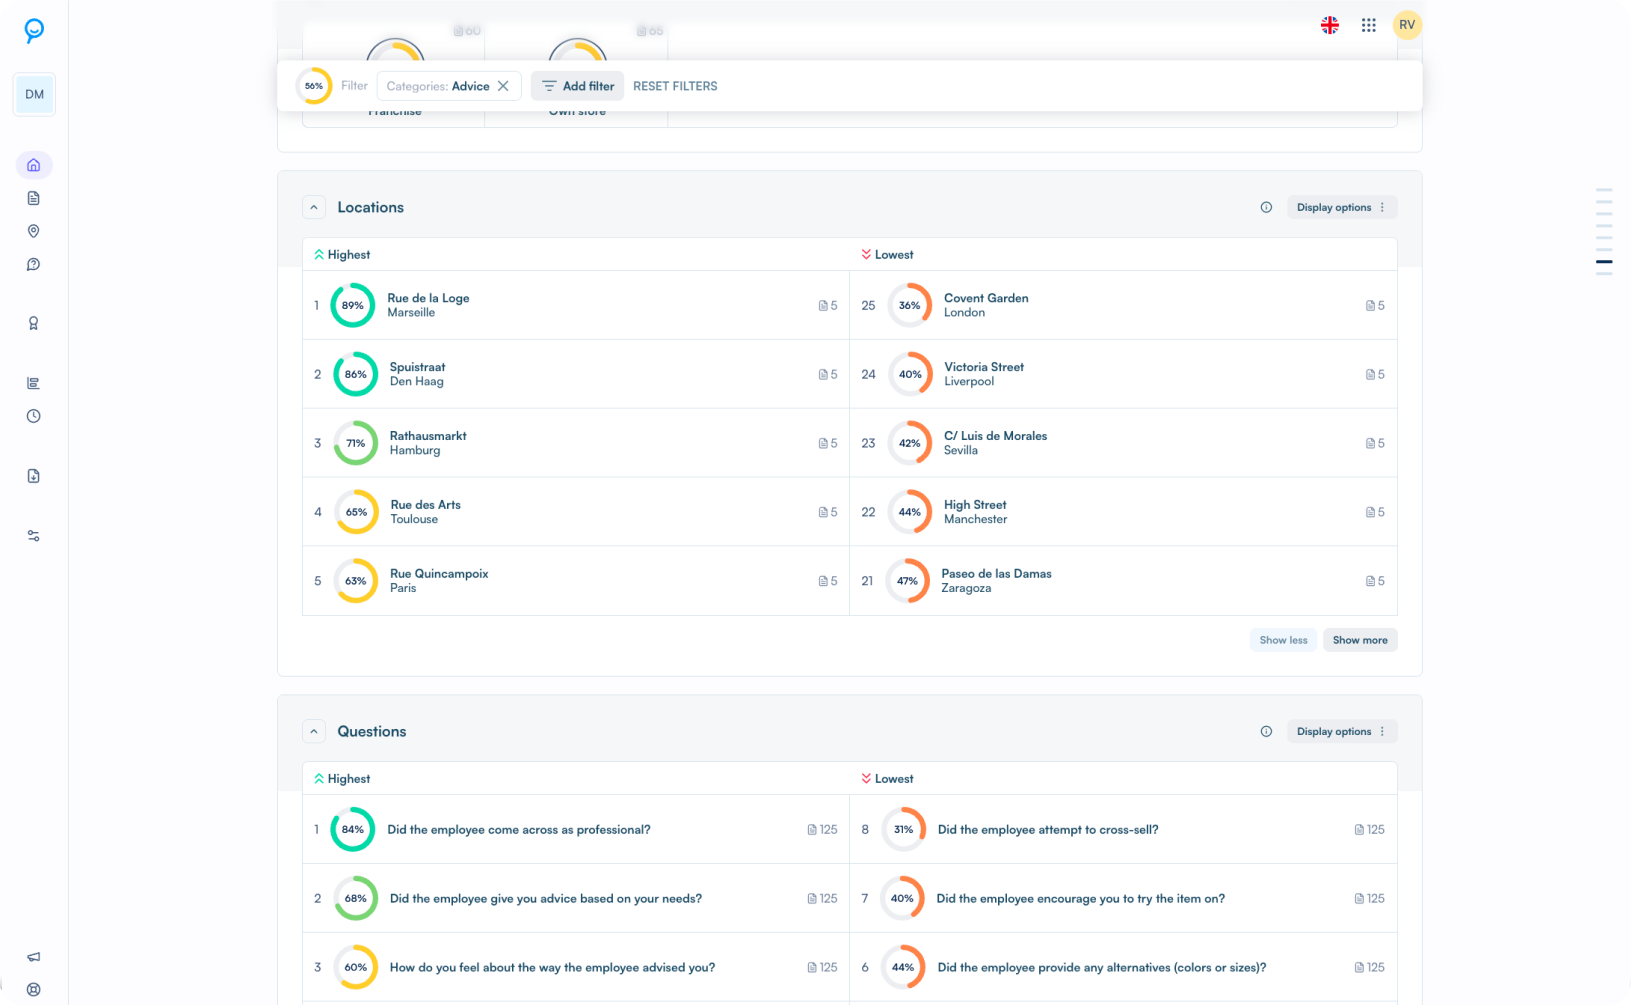
From feedback to action in one clear dashboard


More features
Benchmark your results
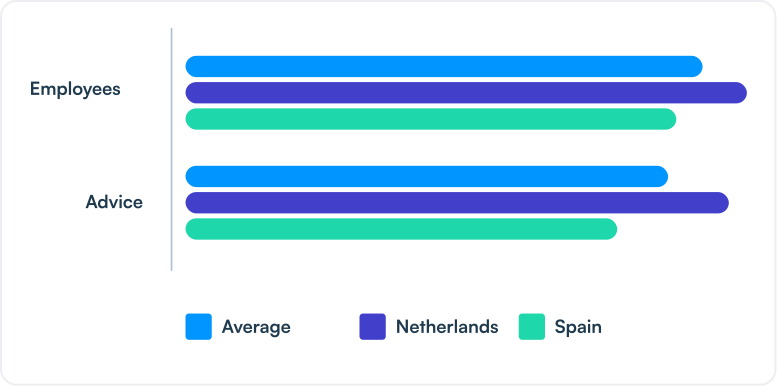
Easily compare all your locations, teams, or categories with the benchmarking feature. For example, filter by research round, customer journey, specific category, or question and see immediately how performances relate to each other.
This way, you can quickly discover which locations excel and where there are growth opportunities. Focus your attention where it yields the most and share best practices within your organization.
Rankings by segment
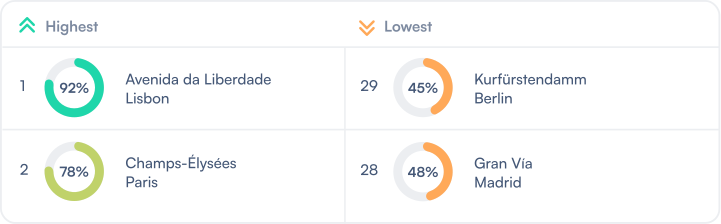
Create overviews of the highest and lowest scores by country, region, or question. Click on a score for insights into responses and areas for improvement. This way, you can see which teams need attention and where training has the most impact. Rankings are the basis for internal challenges and encourage positive competition.
Celebrations
Set a goal, and as soon as that goal is achieved, we celebrate it with a shower of confetti. Achieve the perfect score of 100%? Then it literally rains 💯💯💯. It's the little things that make the experience a bit more personal and motivating. Because in our eyes, the most important thing is that retailers and hospitality embrace feedback and turn learning into something fun.
Analytics and management
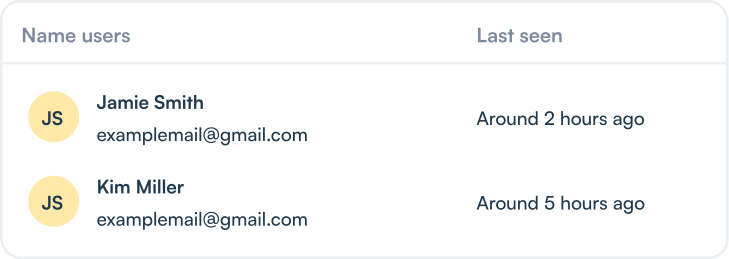
When you invest in software, you want to ensure that everyone is actually using it. That's why admins can manage users themselves and see in the dashboard how often users, such as store and area managers, log in and view results. This way, you can easily check if teams are engaged, prevent insights from being overlooked, and maximize your return on investment.
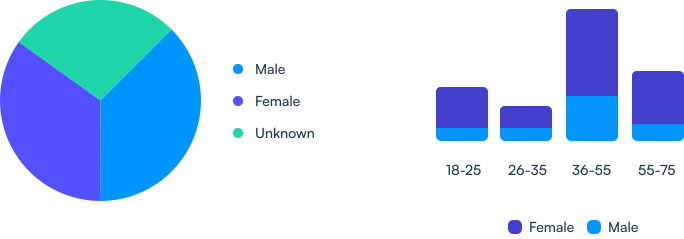
Demographic data
Gain insight into who is behind the numbers. View demographic data of mystery shoppers directly in your dashboard to add extra context and make more targeted decisions.
Export & API
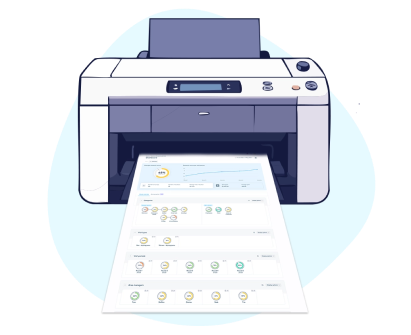
Do you want to analyze or share all the data yourself? Easily export all results to Excel or PDF, exactly in the format you need.Are you working with your own dashboards or BI tools? Through our API, you can connect the platform directly to systems like Tableau, SAP, or Power BI—for maximum flexibility and integration.
Statistics
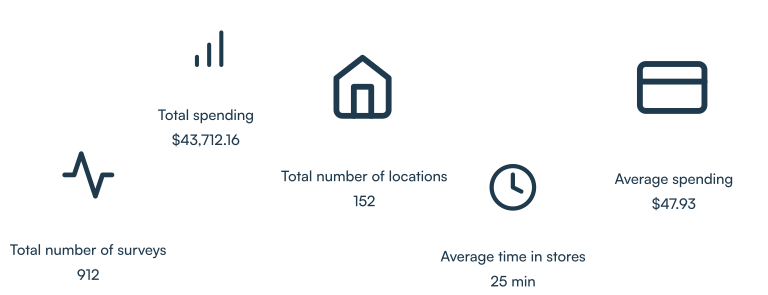
Get a quick overview of the key statistics regarding the total number of completed surveys, visited locations, average time spent in the store, and importantly, the average amount spent. Interestingly, this amount is on average 30% higher than the shopping credit!